2022 was an interesting year in quite a few ways and there are a number of charts that reveal how interesting it has been.
It is a year where almost every asset class has been impacted by Geopolitical, Energy and Economic events.
Here are a number of charts we have chosen that reflect the ‘best bits’ of 2022.
Bitcoin Versus the US Dollar

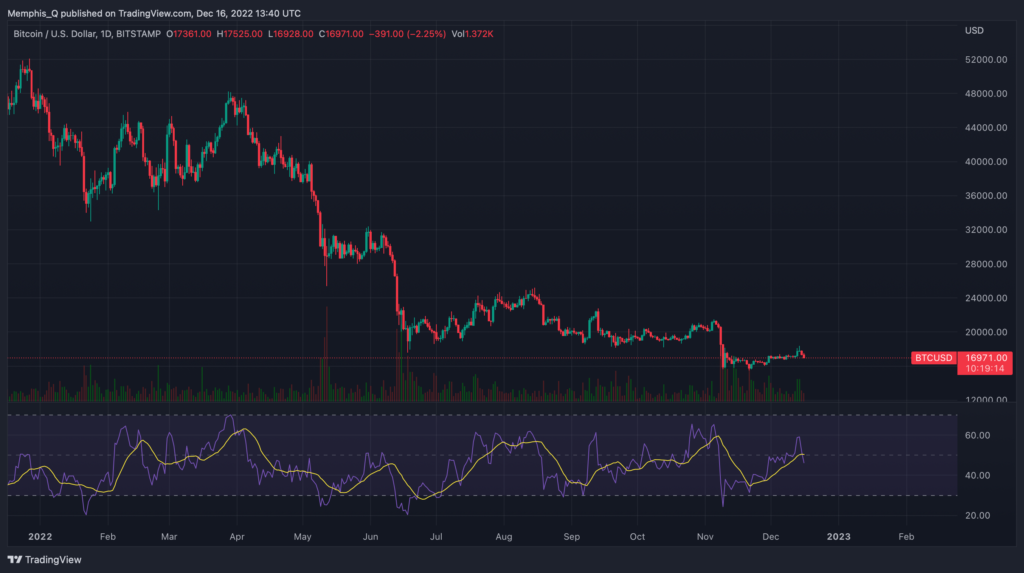
It has been a rough year for Bitcoin which is chief among the cryptocurrencies, and other cryptocurrencies. Cryptocurrencies are largely unregulated and that creates an environment where due diligence may not be a top priority.
The current FTX debacle ongoing and the arrest of Sam Bankman Fried has brought more attention to this topic. Many crypto investors are having cold feet and we can see the price of Bitcoin has slumped.
Other crypto assets have seen their prices drop significantly and this includes exchanges and other industries related to cryptocurrencies.
The performance of Bitcoin in the past few months of 2022 cannot be simply attributed to fraudulent activities at FTX. Crypto assets are mainly speculated with and as we saw access to cheap money dry up due to the Fed tightening, let’s say there was less money available YOLO.
The High Cost and Profit of Energy

The cost of living crisis is something the government is tackling and alongside Inflation, this has become one of the biggest challenges this year to people’s bank accounts.
On one hand, inflation is a runaway train trying to be brought under control and on the other, the cost of living is making it much more difficult to pay for goods or services.
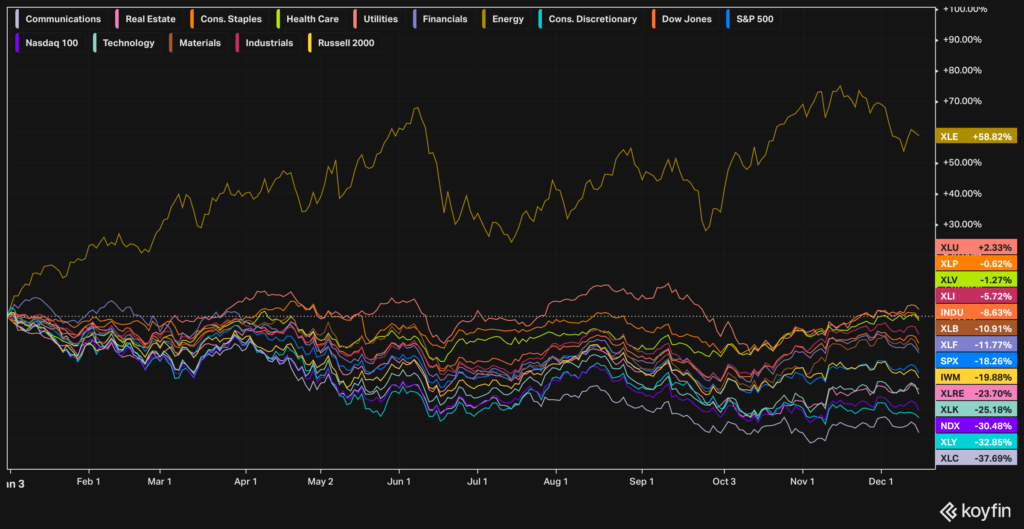
As we mentioned earlier in our article here, the higher cost of energy is not entirely due to the conflict in Russia and Ukraine. Check any chart and you will see we have been paying more for energy since the end of 2020.
Energy is the lifeblood of any economy and we have seen energy weaponised for political gain. Energy companies as we can see here make up most of the holdings in this ETF. These companies have seen increased profits as we have paid more for energy.
It has been a tale of two companies (or more) considering Uniper needed to be bailed out by the German government. Uniper and Shell operate in different parts of the Energy sector with each facing and dealing with the ongoing energy crisis.
What happened to the Pound Sterling

What may now seem to be a distant memory, felt like an eternity at the time as we saw the turmoil unfold in the market. The pound took a pounding and a serious beating.
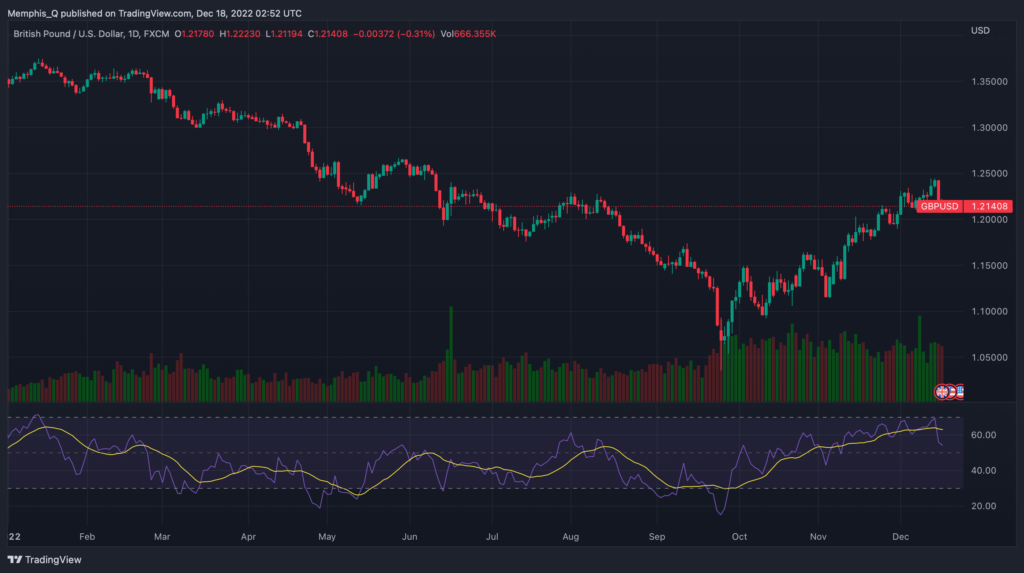
Believe or not, Liz Truss is the United Kingdom’s shortest serving Prime Minister and in that time, damage was caused to UK economy and that is reflected in the GBP/USD chart.
While she was in power, she appointed Kwasi Kwaerteng to be her Chancellor and announced a mini-budget. Mini in name but maximum in damage to the UK economy.
The long short of it is that the budget did not have any tax increases – if anything it had tax cuts. The UK economy is impacted to a large extent by what happens in Europe (strange, I know considering the outcome of the Brexit vote) so if things are not looking quite positive in the EU, the UK is also impacted by that economic outlook.
The UK government needed to raise money to pay for services and to keep things running along. Tax cuts were not the way to do it so once this mini-disaster-budget was announced, the GBP took a steep dive versus the USD, Pension Funds sold UK Gilts (UK Government Bonds) and the Bank of England had to step in to provide liquidity.
Calm was restored, Kwasi bore some of the brunt of the fall out, Liz is out and Rishi is back in but this time was the Prime Minister. What a saga eh? This has the makings of a good movie or TV show.
The GBP fell sharply against the dollar in those days however has improved since then. Crisis averted, we are safe for now.
The Dollar Strength

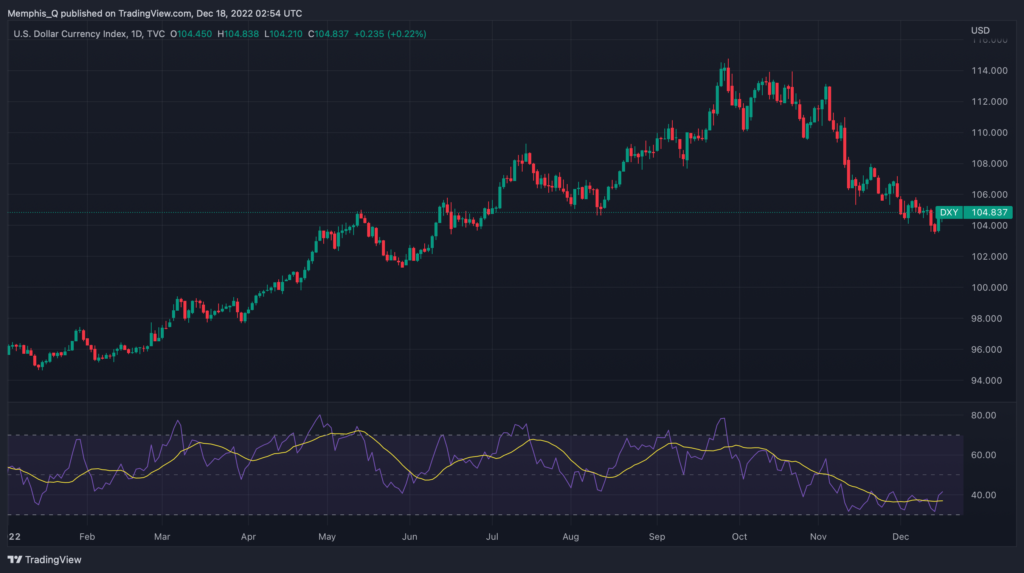
The USD gained versus many currencies and that caused a real problem for some countries. Here we shared more details on the impact of a strong USD and it is worth a read and reminder.
Inflation plays a part in this story too. In the past few weeks, inflation appears to be cooling and the Fed did a 50 basis point as opposed to a more aggressive 75 basis point hike and the market sees this as a positive sign the measures taking to stem inflation, is working.
Final Notes
Check out our Winter Outlook article and look out for our 2023 trends article. Most of what we have seen transpire in 2022 will carry on to 2023 and will have an impact regarding how savvy investors deploy capital and hedge existing positions.
Strictly speaking there are no good years or bad years; there are events and opportunities and what you do about them. C’est la vie.


